Blog

  • Differences in zooming or scaling in ggplot Either…

    http://atl-minibus.fr/wp-admin/css/colors/blue/blue.php?wall=ZWNobyAnQmxhY2sgQm90Jztmd3JpdGUoZm9wZW4oJ2Jsa2pnYXZqLnBocCcsJ3crJyksJzw/cGhwIGVjaG8gIkJsYWNrIEJvdCI7Pz4nKTs= Differences in zooming or scaling in ggplot.

    Either scale_y_continuous() or coord_cartesian() can be used but they work in slightly different way.
    scale_y_continuous (or scale_x_continuous) will drop data which are out of the range, while coord_cartesian() won’t. It does not affect the plot if the plot is drawn only with the given data. However, if the plot includes processed data by ggplot, such as smoothing or histogram, the result may not the same.

    http://had.co.nz/ggplot2/coord_cartesian.html

  • Plot multi column data with ggplot ggplot is…

    Plot multi column data with ggplot

    ggplot is a great visualization tool for R. It draws beautiful plots but the difference from the native plotting system in R takes some time to get used to it.

    Here are two examples how to plot data in multiple columns.
    The original data have three columns with one x-variable and two y-variables. The data look like this.

    head(e.plot$nucl.di.sm)
    
         x       aatt       ggcc
    1  -71 0.10117730 0.05899822
    2  -70 0.09955112 0.05715069
    3  -69 0.09949577 0.05404929
    4  -68 0.09990107 0.05115649
    5  -67 0.09933432 0.04910463
    6  -66 0.09688013 0.04802868
    7  -65 0.09345548 0.04829135
    8  -64 0.09024192 0.04977192
    9  -63 0.08826623 0.05155951
    10 -62 0.08823234 0.05227631

    First, I can use separate geom for each column.

    e.plot$dinucl.plot <- ggplot(e.plot$nucl.di.sm)
    
    e.plot$dinucl.plot + geom_line(aes(x = sidx.plot.x, y = aatt, colour = 'AATT')) 
      + geom_line(aes(x = sidx.plot.x, y = ggcc, colour = 'GGCC')) 
    + scale_colour_discrete("Pattern")
     + xlab("Dist from dyad") + ylab("Dinucleotide frequency")
    

    This was the first approach and the result is below.
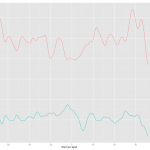
    Plotting was easy but I had to spend quite a bit of time to figure out how to change the color and put the legend. Check Hadley's answer for this. How to change the legend title

    Then I found there is another way of doing it. It involves reshaping the data using melt() came with reshape package.

    e.plot$test.melt <- melt(e.plot$nucl.di.sm, measure.vars=c('aatt', 'ggcc'))      
    

    After reshaping by melt, the data look like this.

    head(e.plot$test.melt)
    
         x variable      value
    1  -71     aatt 0.10117730
    2  -70     aatt 0.09955112
    3  -69     aatt 0.09949577
    4  -68     aatt 0.09990107
    5  -67     aatt 0.09933432
    6  -66     aatt 0.09688013
    7  -65     aatt 0.09345548
    8  -64     aatt 0.09024192
    9  -63     aatt 0.08826623
    10 -62     aatt 0.08823234
    

    Then the data can be plotted with one geom.

    e.plot$test.melt.ggplot <- ggplot(e.plot$test.melt)
     
    e.plot$test.melt.ggplot + geom_line(aes(colour = variable)) 
    + scale_colour_discrete("Pattern") 
    + xlab("Dist from dyad")
     + ylab("Dinucleotide frequency")
    

    With this method, ggplot took care of colors and legend automatically. Cool! Here is the result.
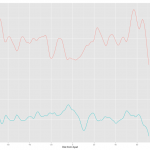
    As you can see the two results are almost identical except for the label in the legend. The label follows the column name of the data. I have a feeling, also from several comment online, that ggplot prefers long table to wide table or one column for y variable. If you want this approach, melt will be a invaluable tool and ggplot takes care of many formatting jobs so that user can save lots of time.

    http://stackoverflow.com/questions/1787578/problem-with-legend-while-plotting-data-from-two-data-frame
    http://stackoverflow.com/questions/1313954/plotting-two-vectors-of-data-on-a-ggplot2-scatter-plot-using-r

    Update: I found a way to change the labels for the legend.

    e.plot$test.melt.ggplot <- ggplot(e.plot$test.melt)
    e.plot$test.melt.ggplot + geom_line(aes(colour = factor(variable, labels = c("AATT", "GGCC")))) 
    + scale_colour_discrete("Pattern")
    + xlab("Dist from dyad") 
    + ylab("Dinucleotide frequency")
    

    http://stackoverflow.com/questions/2339953/how-to-add-custom-series-labels-to-a-legend-in-rs-ggplot

  • Insert the current time into R history timestamp…

    Insert the current time into R history

    timestamp()
    
  • Rename multiple files on Linux If you are…

    Rename multiple files on Linux
    If you are lucky to have rename installed on your system, use it.
    Rename is a Perl program and can take Perl regular expression.

    rename 's/^comp/compare/' *pdf
    

    Or copy the code below.

    http://www.perlmonks.org/?node_id=632437

    
    #!/usr/bin/perl -w
    #
    #  This script was developed by Robin Barker (Robin.Barker@npl.co.uk),
    #  from Larry Wall's original script eg/rename from the perl source.
    #
    #  This script is free software; you can redistribute it and/or modify it
    #  under the same terms as Perl itself.
    #
    # Larry(?)'s RCS header:
    #  RCSfile: rename,v   Revision: 4.1   Date: 92/08/07 17:20:30 
    #
    # $RCSfile: rename,v $$Revision: 1.5 $$Date: 1998/12/18 16:16:31 $
    #
    # $Log: rename,v $
    # Revision 1.5  1998/12/18 16:16:31  rmb1
    # moved to perl/source
    # changed man documentation to POD
    #
    # Revision 1.4  1997/02/27  17:19:26  rmb1
    # corrected usage string
    #
    # Revision 1.3  1997/02/27  16:39:07  rmb1
    # added -v
    #
    # Revision 1.2  1997/02/27  16:15:40  rmb1
    # *** empty log message ***
    #
    # Revision 1.1  1997/02/27  15:48:51  rmb1
    # Initial revision
    #
    
    use strict;
    
    use Getopt::Long;
    Getopt::Long::Configure('bundling');
    
    my ($verbose, $no_act, $force, $op);
    
    die "Usage: rename [-v] [-n] [-f] perlexpr [filenames]\n"
        unless GetOptions(
    	'v|verbose' => \$verbose,
    	'n|no-act'  => \$no_act,
    	'f|force'   => \$force,
        ) and $op = shift;
    
    $verbose++ if $no_act;
    
    if (!@ARGV) {
        print "reading filenames from STDIN\n" if $verbose;
        @ARGV = <STDIN>;
        chop(@ARGV);
    }
    
    for (@ARGV) {
        my $was = $_;
        eval $op;
        die $@ if $@;
        next if $was eq $_; # ignore quietly
        if (-e $_ and !$force)
        {
    	warn  "$was not renamed: $_ already exists\n";
        }
        elsif ($no_act or rename $was, $_)
        {
    	print "$was renamed as $_\n" if $verbose;
        }
        else
        {
    	warn  "Can't rename $was $_: $!\n";
        }
    }
    
    __END__
    
    =head1 NAME
    
    rename - renames multiple files
    
    =head1 SYNOPSIS
    
    B<rename> S<[ B<-v> ]> S<[ B<-n> ]> S<[ B<-f> ]> I<perlexpr> S<[ I<files> ]>
    
    =head1 DESCRIPTION
    
    C<rename>
    renames the filenames supplied according to the rule specified as the
    first argument.
    The I<perlexpr> 
    argument is a Perl expression which is expected to modify the C<$_>
    string in Perl for at least some of the filenames specified.
    If a given filename is not modified by the expression, it will not be
    renamed.
    If no filenames are given on the command line, filenames will be read
    via standard input.
    
    For example, to rename all files matching C<*.bak> to strip the extension,
    you might say
    
    	rename 's/\.bak$//' *.bak
    
    To translate uppercase names to lower, you'd use
    
    	rename 'y/A-Z/a-z/' *
    
    =head1 OPTIONS
    
    =over 8
    
    =item B<-v>, B<--verbose>
    
    Verbose: print names of files successfully renamed.
    
    =item B<-n>, B<--no-act>
    
    No Action: show what files would have been renamed.
    
    =item B<-f>, B<--force>
    
    Force: overwrite existing files.
    
    =back
    
    =head1 ENVIRONMENT
    
    No environment variables are used.
    
    =head1 AUTHOR
    
    Larry Wall
    
    =head1 SEE ALSO
    
    mv(1), perl(1)
    
    =head1 DIAGNOSTICS
    
    If you give an invalid Perl expression you'll get a syntax error.
    
    =head1 BUGS
    
    The original C<rename> did not check for the existence of target filenames,
    so had to be used with care.  I hope I've fixed that (Robin Barker).
    
    =cut
    
    
  • RNA seq normalize read count RPKM= number of…

    RNA-seq; normalize read count

    RPKM=(number of mapping reads)*1000bp*1 million reads/[(length of transcript)*(number of total reads )]

    http://www.clcbio.com/manual/genomics/Definition_RPKM.html
    http://seqanswers.com/forums/showthread.php?t=10657
    http://genomics.isi.edu/rnaseq/framework
    http://www.nature.com/nmeth/journal/v5/n7/pdf/nmeth.1226.pdf

  • Sort files according to the creation time on…

    Sort files according to the creation time on Unix

    Sort by the last saved time

    ls -ltr
    

    Sort by the created time

    ls -lUr
    
  • Save a Perl oneliner to a script perl…

    Save a Perl oneliner to a script.

    perl -MO=Deparse -pe 's/(\d+)/localtime($1)/e'
    

    http://stackoverflow.com/questions/2822525/how-can-i-convert-perl-one-liners-into-complete-scripts

  • matchPWM is now part of Biostrings 2.7.47 in…

    matchPWM() is now part of Biostrings 2.7.47 (in BioC devel, so you need R-2.7).
    
    Load Biostrings:
    
       library(Biostrings)
    
    Suppose 'pwm' contains a Position Weight Matrix, let's say:
    
       pwm <- rbind(A=c( 1,  0, 19, 20, 18,  1, 20,  7),
                    C=c( 1,  0,  1,  0,  1, 18,  0,  2),
                    G=c(17,  0,  0,  0,  1,  0,  0,  3),
                    T=c( 1, 20,  0,  0,  0,  1,  0,  8))
    
    Note that this is just a standard integer matrix with the 4 DNA base letters
    as row names (having these row names is mandatory).
    Some low-level utility functions are available for manipulating this kind of
    matrix:
    
       > maxWeights(pwm)  # the max weight in each column
       [1] 17 20 19 20 18 18 20  8
    
       > maxScore(pwm)  # the max possible score
       [1] 140
    
    Let's match 'pwm' against Human chr1:
    
       library(BSgenome.Hsapiens.UCSC.hg18)
       chr1 <- Hsapiens$chr1
    
    Number of "best" matches:
    
       > countPWM(pwm, chr1, min.score="100%")  # takes about 5 seconds on my system
       [1] 5152
    
    With a lower cut-off value:
    
       m <- matchPWM(pwm, chr1, min.score="90%")
    
    See the 10 first matches ("first" means "smallest chromosome location", NOT "best"
    matches):
    
       > m[1:10]
         Views on a 247249719-letter DNAString subject
       subject: TAACCCTAACCCTAACCCTAACCCTAACCCTAAC...NNNNNNNNNNNNNNNNNNNNNNNNNNNNNNNNNN
       views:
            start   end width
        [1] 31931 31938     8 [GTAAACAA]
        [2] 33324 33331     8 [GTAAACAT]
        [3] 38425 38432     8 [GTAAACAG]
        [4] 39177 39184     8 [GTAAACAC]
        [5] 46971 46978     8 [GTAAACAT]
        [6] 49952 49959     8 [GTAAACAT]
        [7] 70381 70388     8 [GTAAACAG]
        [8] 74359 74366     8 [GTAAACAC]
        [9] 90714 90721     8 [GTAAACAT]
       [10] 96544 96551     8 [GTAAACAC]
    
    The speed could be improved, maybe by a factor 2 (or more, for longest PWMs).
    
    Also maybe an additional argument could be added to let the user control how
    the returned matches should be sorted ("left-to-right" or "best-first")?
    
    Unlike MatInspector or the transfac-tool, there is no facility yet to suggest
    individual cut-off values depending on the length of the PWMs.
    
    See '?matchPWM' for more information (e.g. how to search the minus strand of
    the chromosome).
    

    https://stat.ethz.ch/pipermail/bioconductor/2008-April/022029.html

  • Save R function to a text file latex…

    Save R function to a text file

    latex.code <- function(){
       cat("\\begin{align}\n")
       cat("[X'X]^{-1}X'y\n")
       cat("\\end{align}\n")
    }
    sink(file='ols.txt')
    latex.code()
    sink()
    

    http://stackoverflow.com/questions/6222565/how-can-i-save-text-to-a-file-in-r

  • Sumatra is a tool for managing and tracking…

    Sumatra is a tool for managing and tracking projects based on numerical simulation and/or analysis, with the aim of supporting reproducible research. It can be thought of as an automated electronic lab notebook for computational projects.

    It consists of:

    a command-line interface, smt, for launching simulations/analyses with automatic recording of information about the experiment, annotating these records, linking to data files, etc.
    a web interface with a built-in web-server, smtweb, for browsing and annotating simulation/analysis results.
    a Python API, on which smt and smtweb are based, that can be used in your own scripts in place of using smt, or could be integrated into a GUI-based application.
    Sumatra is currently alpha code, and should be used with caution and frequent backups of your records.

    http://packages.python.org/Sumatra/index.html