Tag: R

  • scatter plot equivalent to pairs by ggplot http…

    essayez ce site scatter plot equivalent to pairs() by ggplot.

    http://stackoverflow.com/questions/3735286/pairs-equivalent-in-ggplot2

    Hadley recommends using the GGally package instead. It has a function, ggpairs that is a vastly improved pairs plot (lets you use non-continuous variables in your data frames). It plots different plots in each square, depending on the variable types:

  • Probability density function in R http www cyclismo…

    Probability density function in R

    http://www.cyclismo.org/tutorial/R/probability.html

    Chi square goodness-of-fit test in R
    http://ww2.coastal.edu/kingw/statistics/R-tutorials/goodness.html

    Chi square independence test in R
    http://ww2.coastal.edu/kingw/statistics/R-tutorials/independ.html

    ANOVA in R
    http://personality-project.org/r/r.anova.html

  • http jeromyanglim blogspot ca 2010 05 abbreviations of…

    http://jeromyanglim.blogspot.ca/2010/05/abbreviations-of-r-commands-explained.html

    250+ R commands.
    Often times R users suffer from difficulties finding what commands are available for a specific process.
    This lists 250+ R commands in table.

  • R color palettes # Basic grDevice rainbow topo…

    R color palettes

    1. Basic grDevice

    rainbow()
    topo.colors()
    terrain.colors()
    heat.colors()

    my.palette <- terrain.colors(100)
    
    1. RColoBrewer package
    display.brewer.all()
    

    my.palette <- brewer.pal(n, name) For example, my.palette <- brewer.pal(9, "Blues") However, the number of colors is limited up to 9, in most colors. Then use this.

    more.color.palette <- colorRampPalette(brewer.pal(9,"Blues"))(100)
    

    http://stackoverflow.com/questions/3832850/color-schemes-in-r
    http://www.compbiome.com/2010/12/r-using-rcolorbrewer-to-colour-your.html

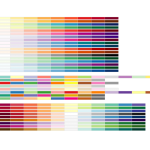
  • RColorBrewer palette names

    RColorBrewer palette names.

  • Change the label of legend not by changing…

    Change the label of legend not by changing the data.

    # data
    grp <- gl(n=4,k=20,labels=c("group a","group b","group c", "group d"))
    value <- runif(n=80, min=10, max=150)
    outcome <- cut(value,2)
    data <- data.frame(grp,value,outcome)
    
    # Option 1
    # breaks should be exactly the same as the levels of the factor
    ggplot(data, aes(grp, fill=outcome)) + geom_bar() +xlab("group") +
        ylab("number of subjects") + 
        scale_fill_discrete("Serologic response", 
                            breaks=c("(12.1,79.7]","(79.7,147]"),   # should be the same as the levels of the factor
                            labels=c("double negative", "positive for a and/or b")
                            )
    
    # Option 2
    # simpler because factor() takes care of the levels of the factor
    ggplot(data, aes(grp, 
             fill=factor(outcome,labels=c("double negative","positive for a")))) + 
        geom_bar() +xlab("group") +ylab("number of subjects") +
        labs(fill="Serologic response")


    http://stackoverflow.com/questions/7323191/how-do-i-manually-change-the-key-labels-in-a-legend-in-ggplot2

  • R factors levels labels # sample data originally…

    R factors, levels, labels

    # sample data originally numbers
    # 1 = male, 2 = female
    
    people.n <- c(1, 1, 2, 2, 2)
    people.c <- c("male", "male", "female", "female", "female")
    
    # create a factor
    people.n.f <- factor(people.n, levels = c(1, 2), labels = c("male", "female"))
    people.c.f <- factor(people.c, levels = c("male", "female"), labels = c("male", "female"))
    
    # if you want to change the order of the levels, 
    people.n.f <- factor(people.n, levels = c(2, 1), labels = c("female", "male"))
    
    # levels follows alphabetical order if not specified
    # compare this with people.c.f
    factor(people.c)
    
    # without specifying levels and labels
    # the original data will be used
    factor(people.n)
    
    # once used to create a factor, levels and labels are merged.
    # there is no labels attribute in factor.
    # correct
    levels(people.c.f)
    levels(people.c.f) <- c("man", "woman")
    people.c.f
    
    #wrong
    labels(people.c.f)
    labels(people.c.f) <- c("man", "woman")
    

    Conclusion
    By default, factor() order the levels alphabetical order or numerical order.
    If you want to change the sorting order of levels manually, you need to set it when the factor is created.
    It can not be changed later, even though the levels can be changed.

    When creating a factor, the data and the order should be matched as the example.

    factor(people.c, levels = c("male", "female"), labels = c("male", "female")) 
              ^ ---- same data ---------^    ^-------------same order -----^
    

  • Nice guide for R graphics http blog revolutionanalytics…

    Nice guide for R graphics

    http://blog.revolutionanalytics.com/2009/01/10-tips-for-making-your-r-graphics-look-their-best.html

  • Treemap in R 1 Portpolio package Pros Quick…

    Treemap in R

    1. Portpolio package
    Pros: Quick, simple, bigger output
    Cons: One color scheme

    An Easy Way to Make a Treemap

    2. Treemap package
    Pros: More customization, several algorithms
    Cons: smaller output size

    http://cran.r-project.org/web/packages/treemap/treemap.pdf

    Remarks:
    Index must be factor.
    Different types
    comp: (size – color) / color
    dens: color / size

  • Customize the color order and label of the…

    Customize the color, order and label of the legend in ggplot2
    Use scale_colour_manual()

    scale_colour_manual(values = c("red", "blue"), breaks = c("S2", "S1"), labels = c("sample1", "sample2"))
    

    http://had.co.nz/ggplot2/scale_manual.html