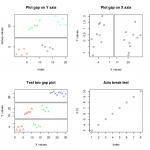
rencontre femme mature sur rueil malmaison Using discontinuous axis or “breaks” may not be a good idea to visualize data.
Instead, use two plots, one with the whole data and another for zoomed data.
However, if the situation is not allowed, there is an R package to do it.
The package plotrix can put breaks or gaps on the axes.
