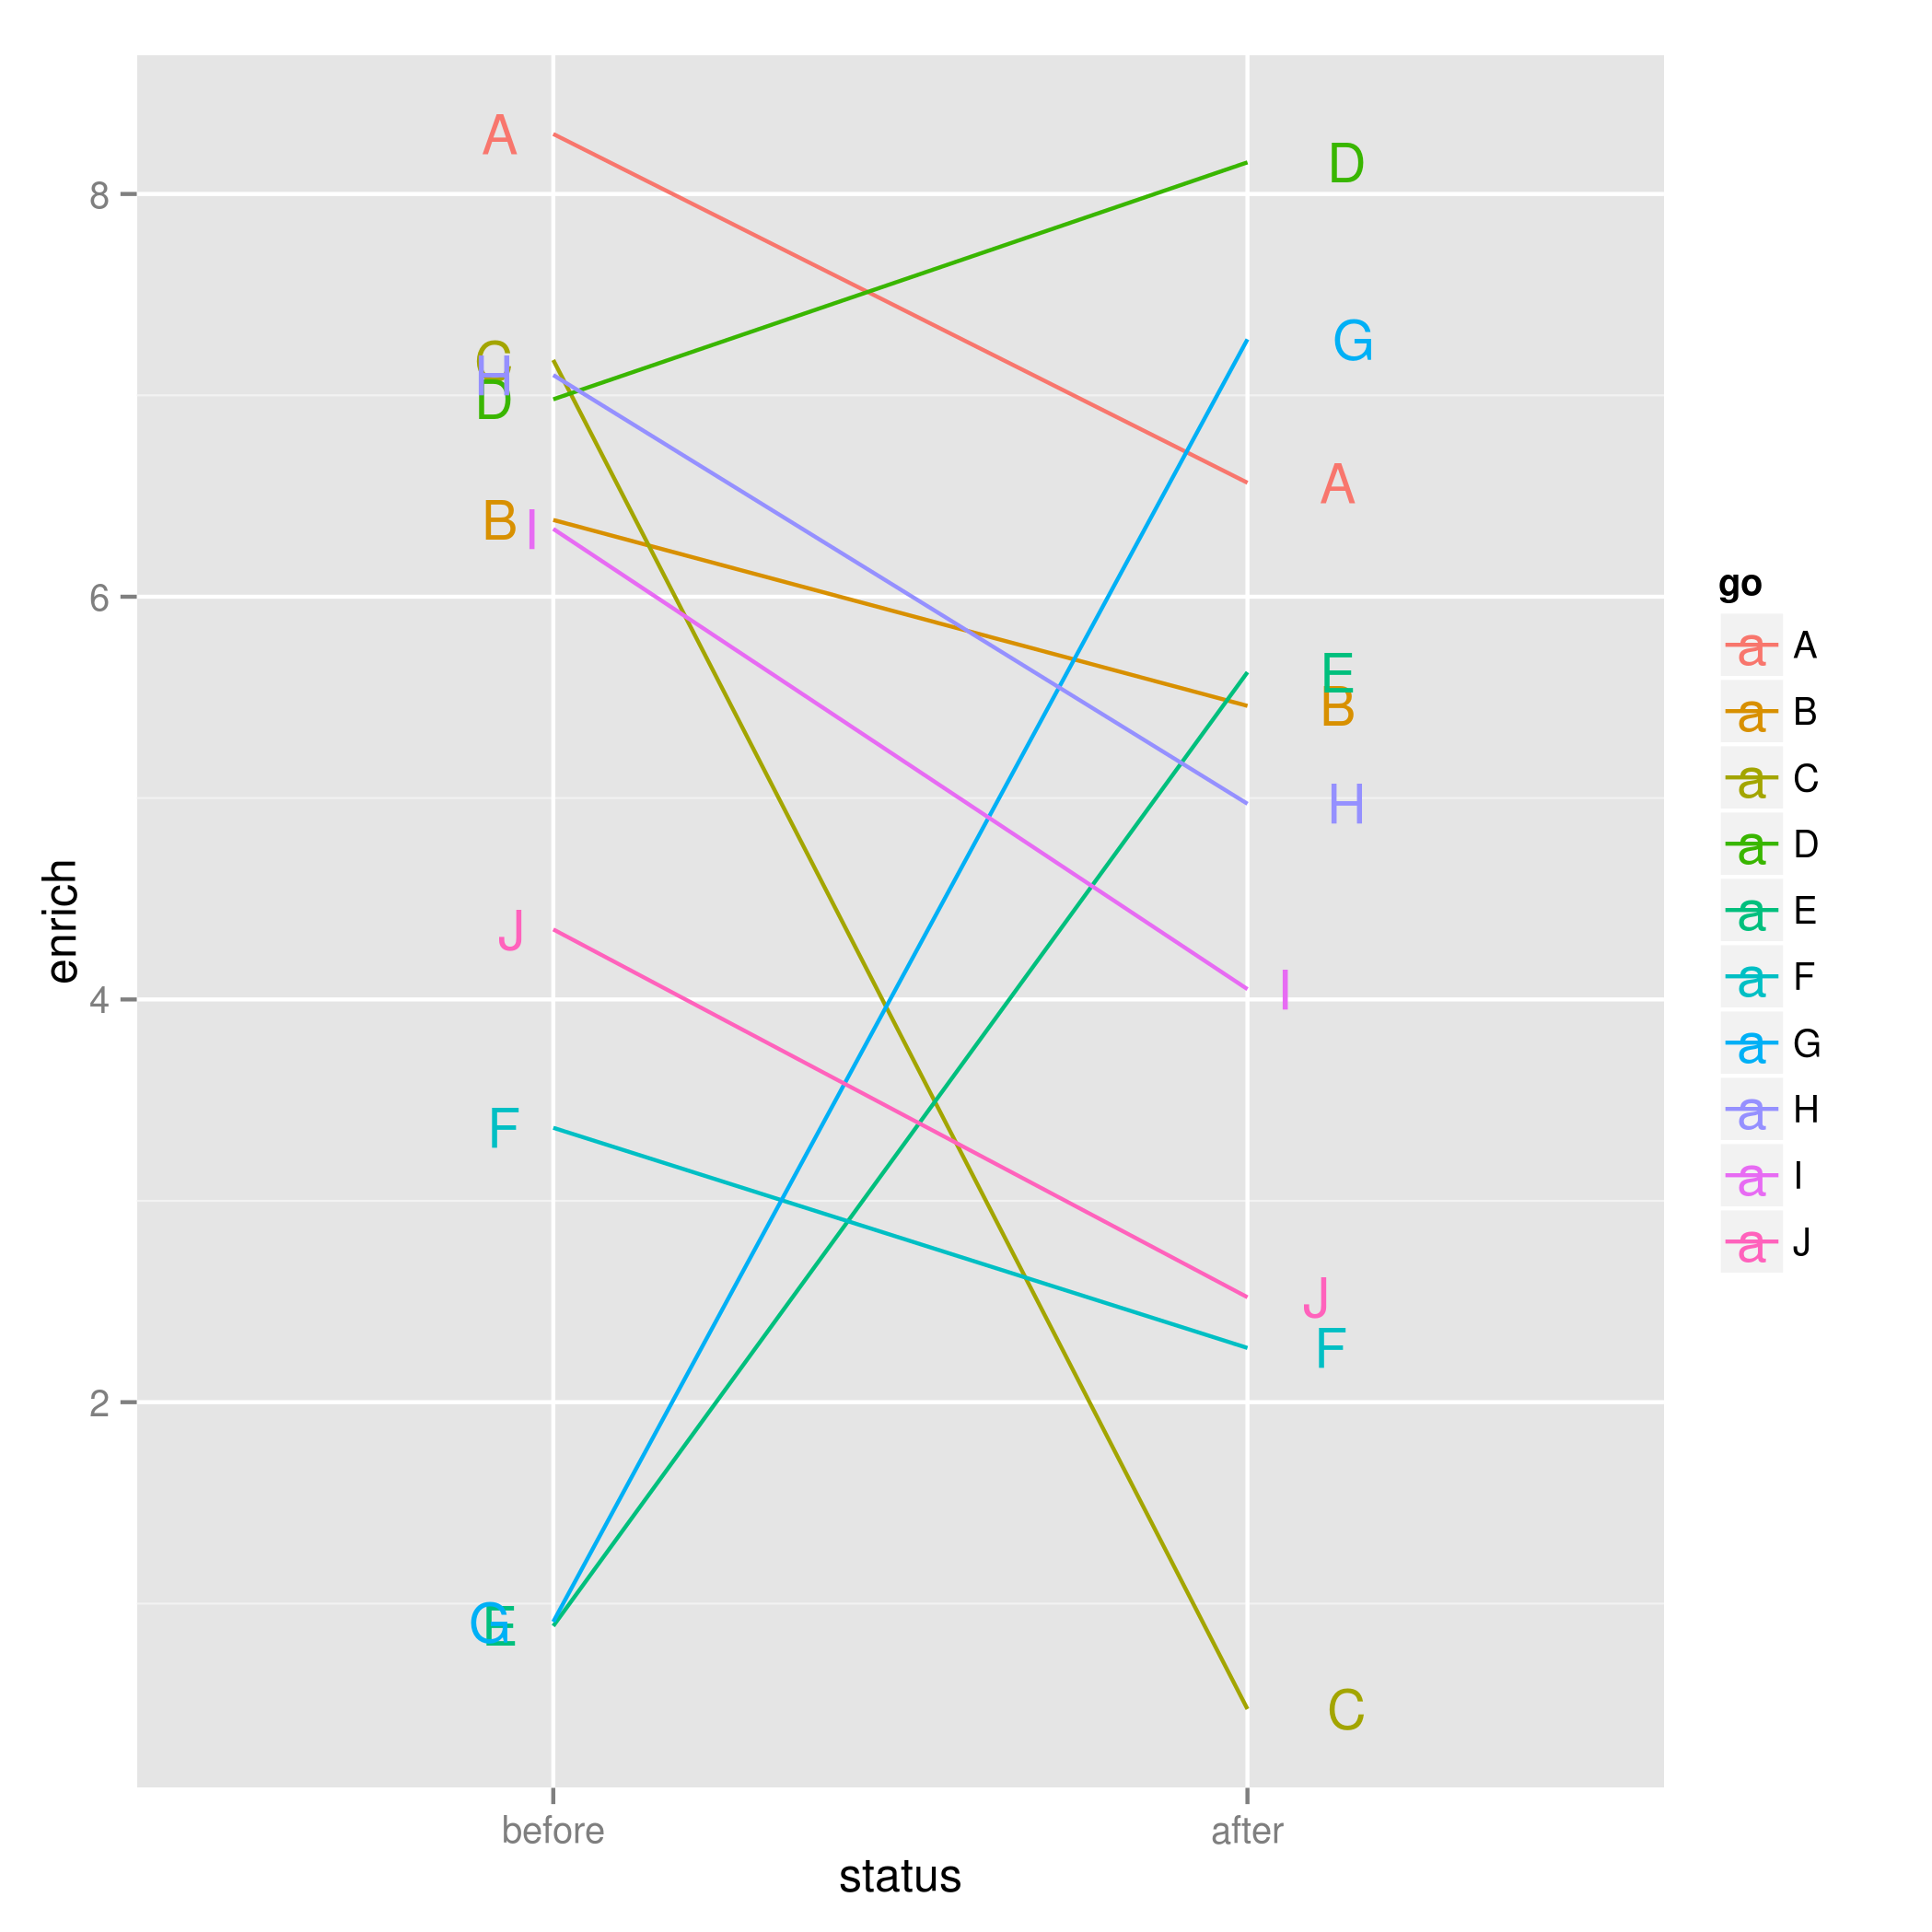
Slopegraph in R. Slopegraph shows the change of the quantity or rank.
Beautiful slopegraph example. http://www.drewconway.com/zia/
Theory of slopegraph. http://www.edwardtufte.com/bboard/q-and-a-fetch-msg?msg_id=0003nk
An R and ggplot2 code example of slopegraph https://github.com/leondutoit/slopegraph/blob/master/slopegraph.
R Example code.
Generate sample data
a <- data.frame(go = LETTERS[1:10], enrich = runif(10, 0, 10))
b <- data.frame(go = LETTERS[1:10], enrich = runif(10, 0, 10))
a <- cbind(a, status ='before')

b <- cbind(b, status = 'after')
ab.melt <- rbind(a, b)
Add an offset column for label positioning
ab.melt <- transform(ab.melt, offset = c(rep(2, times = 10), rep(-2, times = 10)))

library(ggplot2)
ggplot(data = ab.melt, aes(x = status, y = enrich)) + geom_line(aes(group = go, colour = go)) + geom_text(aes(label = go, hjust = offset, colour = factor(go)))
Leave a Reply
You must be logged in to post a comment.