https://www.writelatex.com/
Online LaTeX editor which has Vim and Emacs flavored editor.
https://www.writelatex.com/
Online LaTeX editor which has Vim and Emacs flavored editor.
Turn numeric into categorical data.
AdultUCI[["age"]] <- ordered(cut(AdultUCI[["age"]], c(15,25,45,65,100)), labels = c("Young", "Middle-aged", "Senior", "Old"))
Two column for LaTeX from Pandoc.
Add twocolumn and replace longtable with supertabular.
\documentclass[twocolumn]{article}
...
\usepackage{supertabular}
...
\begin{supertabular}[c]{@{}lll@{}}
...
\end{supertabular}
To make a figure span over two columns, use figure*.
\begin{figure*}[htbp]
...
\end{figure*}
Diff sort output.
diff <(sort file1) <(sort file2)
Change the order of discrete axis.
Generate a factor with reversed levels or use a new ggplot2 option.
Examples.
df$X1 = with(df, factor(X1, levels = rev(levels(X1))))
http://stackoverflow.com/questions/7418191/sorting-dotplot-factor-axis-in-ggplot
flevels <- levels(PlantGrowth$group)
- Reverse the order of a discrete-valued axis
- Get the levels of the factor
flevels <- rev(flevels)
- "ctrl" "trt1" "trt2"
- Reverse the order
bp + scale_x_discrete(limits=flevels)
- "trt2" "trt1" "ctrl"
http://www.cookbook-r.com/Graphs/Axes_(ggplot2)/#reversing-the-direction-of-an-axis
Set a graph size in dot.
graph [ratio=auto, page=”8,11″]
Selecting objects in Inkscape.
Method 1. Hold down Shift key and use the mouse to click on each object to be selected.
Method 2. Select by colour.
-drag colour selection from lower colour bar and drop into Style in the new menu panel as shown below.
Also you may notice the colour changes to a number in the style box.
Method 3. Hold down the Alt key on your keyboard and drag mouse through items to be selected.
When Alt is held down a red line will be visible, making it easier to select the chosen path.
http://www.inkscapecuttingdesign.com/viewtopic.php?f=25&t=427
Nested Tmux command.
Screen (vim + gnu screen/tmux) is a great tool for vim that split the pane and send vim buffer to
another pane. (Link: http://www.vim.org/scripts/script.php?script_id=2711)
However, when used the plugin in tmux session, the tmux sessions are nested then the command
is not working properly. Then setting a send prefix in .tmuxrc will solve the nested problem.
Command Sequence for Nested Tmux Sessions
Often I’ll run a multiplexer inside another multiplexer and need a command sequence to send things to the inner session. In Screen, this could be accomplished using C-a a
bind-key a send-prefix
From https://mutelight.org/practical-tmux
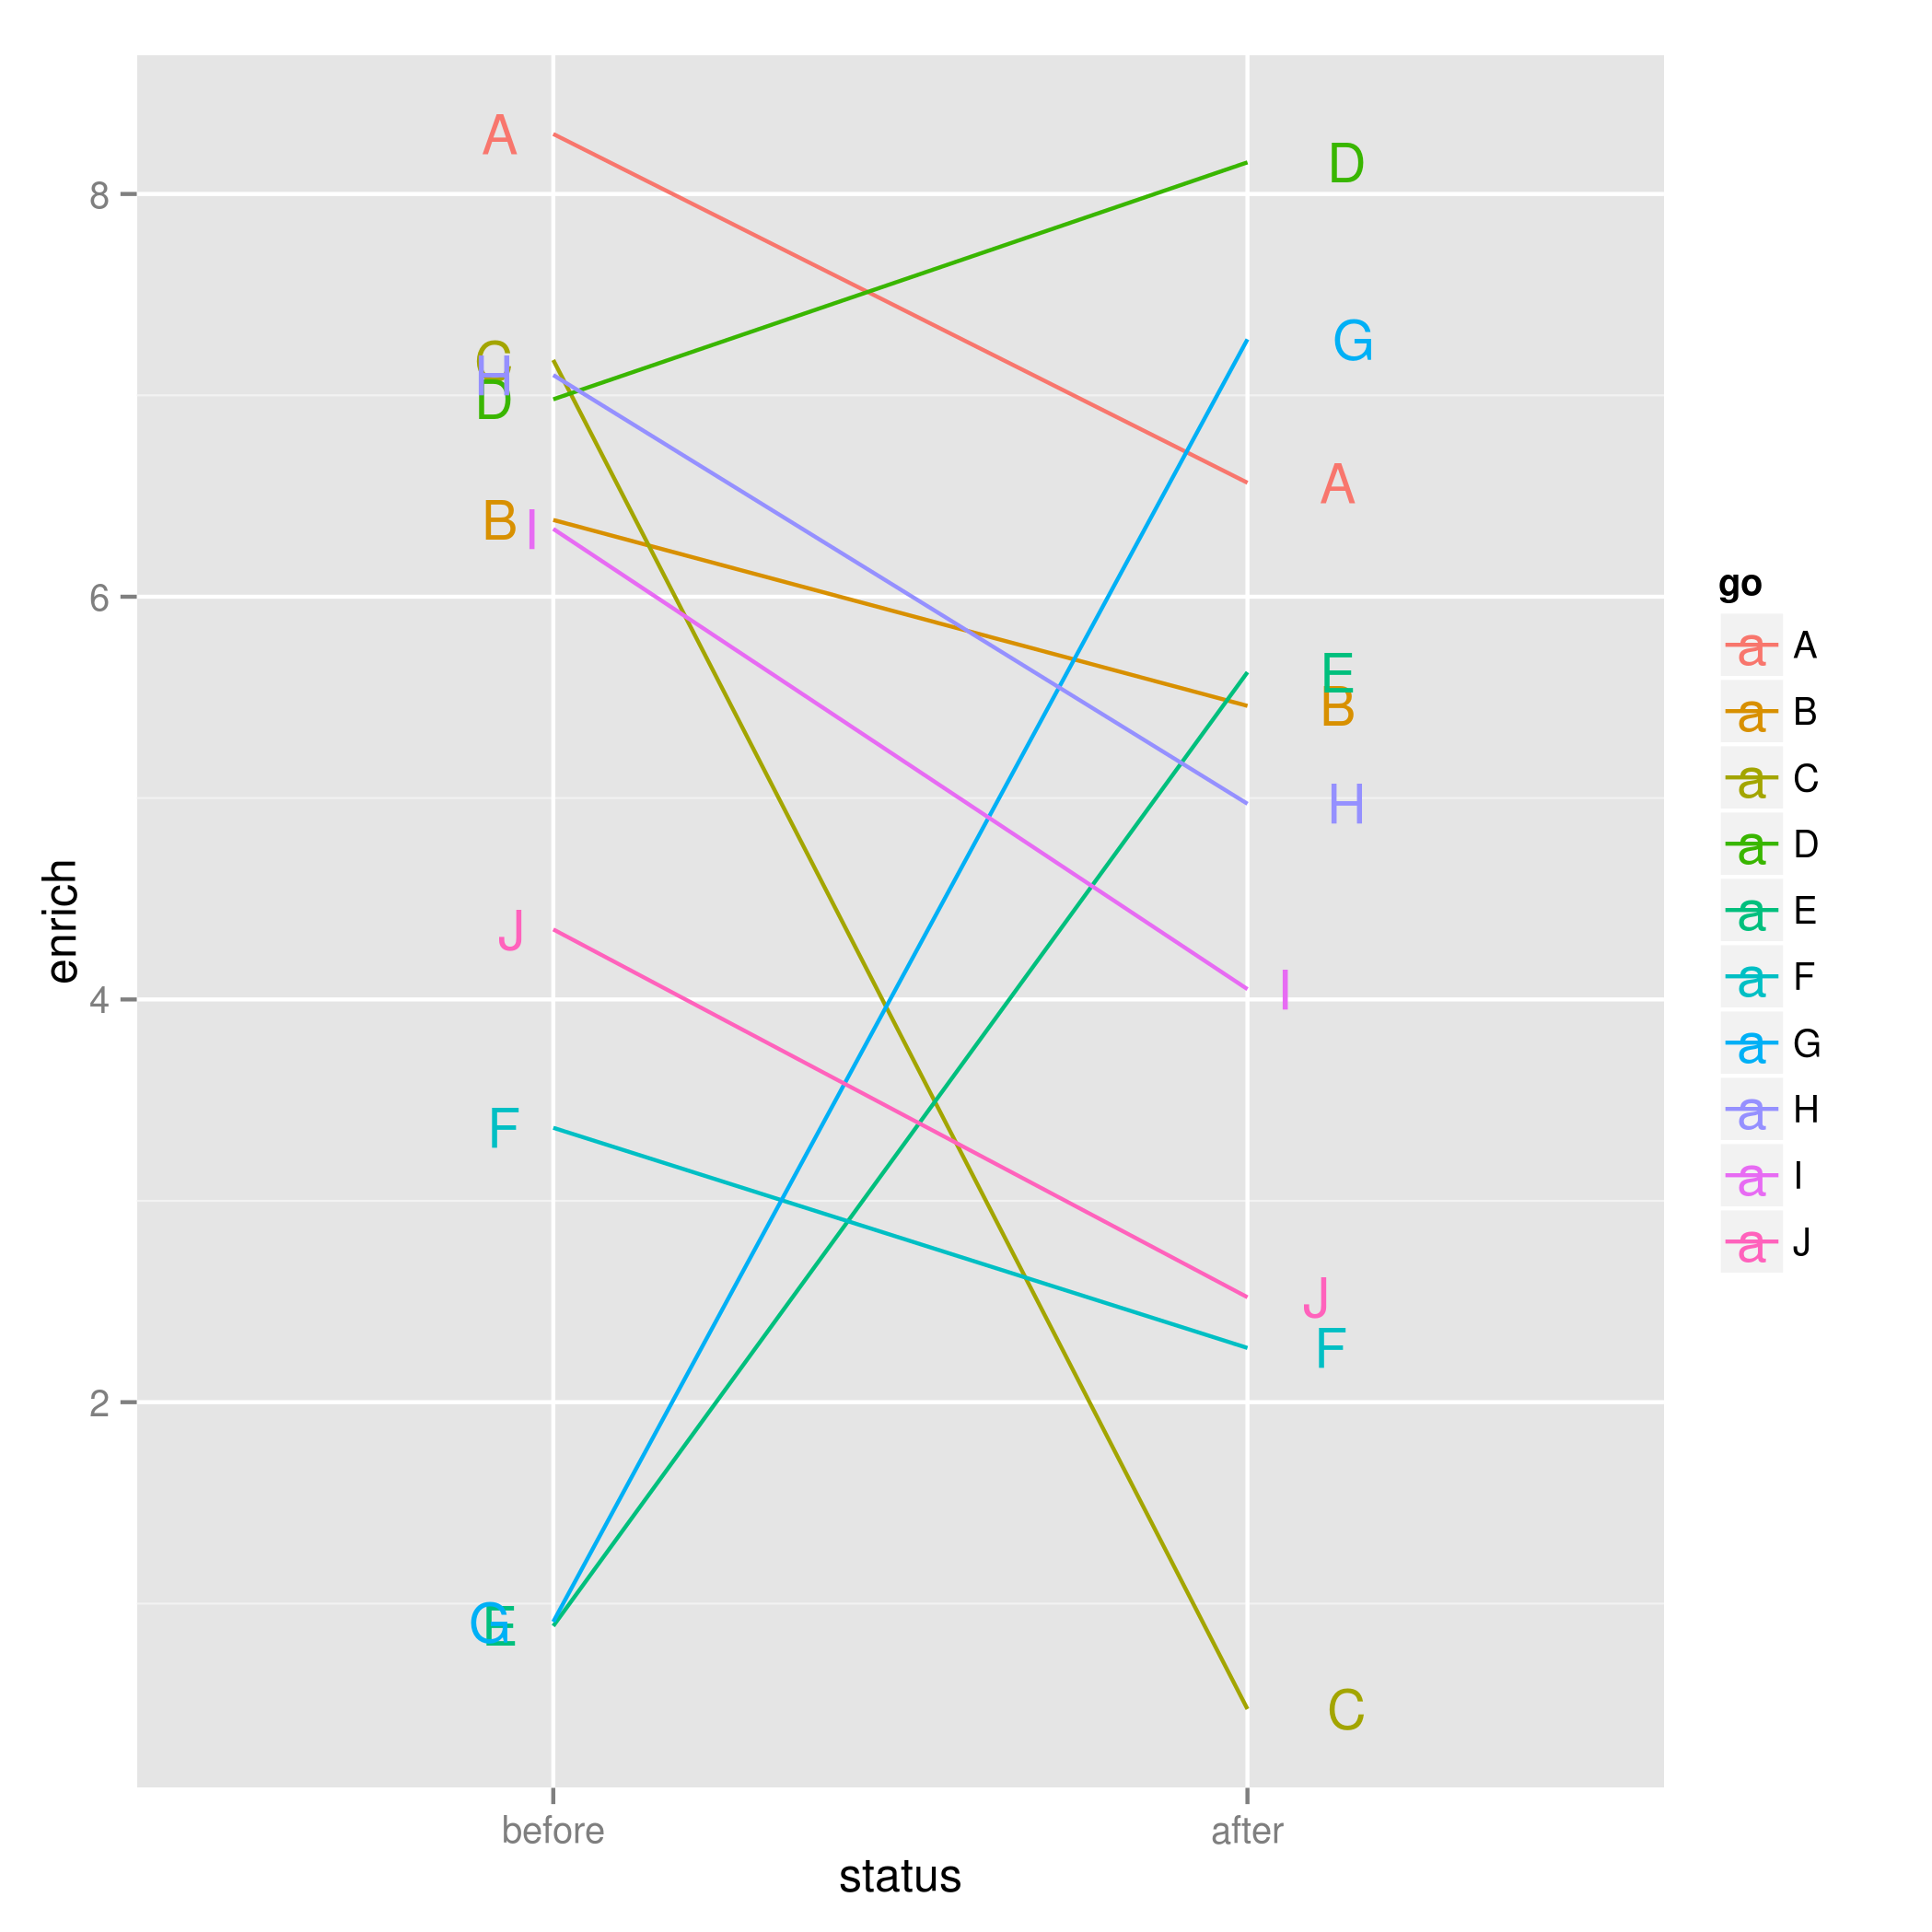
Slopegraph in R. Slopegraph shows the change of the quantity or rank.
Beautiful slopegraph example. http://www.drewconway.com/zia/
Theory of slopegraph. http://www.edwardtufte.com/bboard/q-and-a-fetch-msg?msg_id=0003nk
An R and ggplot2 code example of slopegraph https://github.com/leondutoit/slopegraph/blob/master/slopegraph.
R Example code.
Generate sample data
a <- data.frame(go = LETTERS[1:10], enrich = runif(10, 0, 10))
b <- data.frame(go = LETTERS[1:10], enrich = runif(10, 0, 10))
a <- cbind(a, status ='before')

b <- cbind(b, status = 'after')
ab.melt <- rbind(a, b)
Add an offset column for label positioning
ab.melt <- transform(ab.melt, offset = c(rep(2, times = 10), rep(-2, times = 10)))

library(ggplot2)
ggplot(data = ab.melt, aes(x = status, y = enrich)) + geom_line(aes(group = go, colour = go)) + geom_text(aes(label = go, hjust = offset, colour = factor(go)))
R function matching a function argument against candidate values.
match.arg(arg, choices, several.ok = FALSE)
arg = match.arg(arg)